Version 0.5 has been released.
Serialisation improvements
This release significantly improves the process for serialisation. Serialisation happens when results are returned from an execution, and when passing arguments to another execution. Previously serialisation to JSON was attempted, and if that failed, pickle serialisation was used instead.
With this release, standard Python datatypes are supported by the native serialisation - this includes dicts (with keys that aren't limited to strings), sets and tuples. When the serialiser comes across non-standard types, it uses custom serialisers. A few custom serialisers are now supported for:
- Pandas dataframes (which are serialised to Parquet).
- Pydantic objects (anything that inherits from
BaseModel).
And a pickle serialiser will be used as a fall back.
These custom serialisers are applied to nested values within the datastructure - this means, for example, a Python dict of Pandas dataframes can be serialised - each dataframe will be serialised as a separate 'fragment'.
Logging improvements
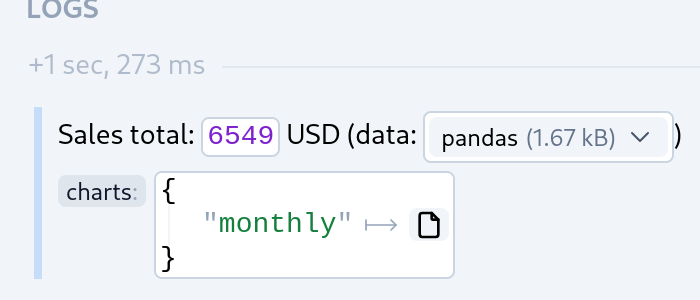
As well as being used for results and arguments, the same serialisation process is now also used for values passed to the logging functions (e.g., cf.log_info(...)), which can optionally be refered to in the template.
For example:
import coflux as cf
import pandas as pd

@cf.task()
def render_chart(sales: pd.DataFrame) -> cf.Asset:
    ax = sales["volume"].plot()
    ax.get_figure().savefig("chart.png")
    return cf.persist_asset("chart.png")

@cf.workflow()
def sales_summary():
    sales_df = pd.DataFrame({"volume": [1018, 1411, 1241, 1317, 1562]})
    chart_asset = render_chart(sales_df)
    cf.log_info(
        "Sales total: {total} USD (data: {sales})",
        total=int(sales_df["volume"].sum()),
        sales=sales_df,
        charts={"monthly": chart_asset},
    )
Here's how the message appears in the UI:

Because assets can be loaded directly into the UI, you can click on the asset symbol and the chart will appear. You can click on the 'pandas' fragment to download the Parquet file from the blob store.
Assets on the graph
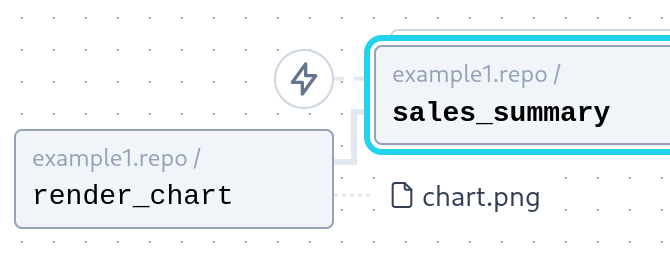
To make assets easier to access, they now get included in the graph view:

As from the log messages, clicking the asset in the graph opens the asset in the browser.
S3 blob store
This release adds support for using S3 as a blob store. Refer to the documentation for details.